How-to simulate Markov chain in R Science 14.04.2014
Introduction
A Markov analysis looks at a sequence of events, and analyzes the tendency of one event to be followed by another. Using this analysis, you can generate a new sequence of random but related events, which will look similar to the original.
A Markov process is useful for analyzing dependent random events - that is, events whose likelihood depends on what happened last. It would NOT be a good way to model a coin flip, for example, since every time you toss the coin, it has no memory of what happened before. The sequence of heads and tails are not inter-related. They are independent events.
But many random events are affected by what happened before. For example, yesterday's weather does have an influence on what today's weather is. They are not independent events.
A Markov model could look at a long sequence of rainy and sunny days, and analyze the likelihood that one kind of weather gets followed by another kind. Let's say it was found that 25% of the time, a rainy day was followed by a sunny day, and 75% of the time, rain was followed by more rain. Let's say we found out additionally, that sunny days were followed 50% of the time by rain, and 50% by sun. Given this analysis, we could generate a new sequence of statistically similar weather by following these steps:
1) Start with today's weather. 2) Given today's weather, choose a random number to pick tomorrow's weather. 3) Make tomorrow's weather "today's weather" and go back to step 2.
What we'd get is a sequence of days like:
Sunny Sunny Rainy Rainy Rainy Rainy Sunny Rainy Rainy Sunny Sunny...
In other words, the "output chain" would reflect statistically the transition probabilities derived from weather we observed.
This stream of events is called a Markov Chain. A Markov Chain, while similar to the source in the small, is often nonsensical in the large. (Which is why it's a lousy way to predict weather.) That is, the overall shape of the generated material will bear little formal resemblance to the overall shape of the source. But taken a few events at a time, things feel familiar.
Math background
If you wanna to see the math background of Markov Chain look at this PDF.
Simulation in R
I'm going to use markovchain package in R. Let's install and load it.
install.packages("markovchain")

library("markovchain")
markovchain objects can be created either in a long way, as the following code shows
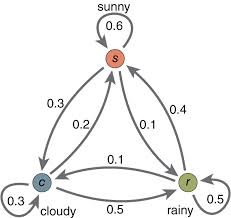
weatherStates = c("sunny", "cloudy", "rain")
byRow = TRUE
weatherMatrix = matrix(data = c(0.70, 0.2,0.1,
0.3,0.4, 0.3,
0.2,0.45,0.35), byrow = byRow, nrow = 3,

dimnames = list(weatherStates, weatherStates))

mcWeather = new("markovchain", states = weatherStates, byrow = byRow,
transitionMatrix = weatherMatrix, name = "Weather")
or in a shorter way, as shown below
mcWeather = new("markovchain", states = c("sunny", "cloudy", "rain"),
transitionMatrix = matrix(data = c(0.70, 0.2,0.1,
0.3,0.4, 0.3,
0.2,0.45,0.35),byrow = byRow, nrow = 3),
name = "Weather")
Operations on markovchain objects can can be easily performed. Using the previously defined matrix we can find what is the probability distribution of expected weather states two and seven days after, given actual state to be cloudy.
initialState = c(0,1,0)
after2Days = initialState * (mcWeather * mcWeather)
after7Days = initialState * (mcWeather^7)

after2Days
#    sunny cloudy rain
# [1,] 0.39 0.355 0.255

after7Days
#       sunny    cloudy      rain
# [1,] 0.4622776 0.3188612 0.2188612
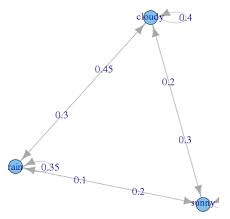
Finally, let's plot Markov chain with weather example.
Useful links
Quote
Categories
- Android
- AngularJS
- Databases
- Development
- Django
- iOS
- Java
- JavaScript
- LaTex
- Linux
- Meteor JS
- Python
- Science
Archive ↓
- September 2024
- December 2023
- November 2023
- October 2023
- March 2022
- February 2022
- January 2022
- July 2021
- June 2021
- May 2021
- April 2021
- August 2020
- July 2020
- May 2020
- April 2020
- March 2020
- February 2020
- January 2020
- December 2019
- November 2019
- October 2019
- September 2019
- August 2019
- July 2019
- February 2019
- January 2019
- December 2018
- November 2018
- August 2018
- July 2018
- June 2018
- May 2018
- April 2018
- March 2018
- February 2018
- January 2018
- December 2017
- November 2017
- October 2017
- September 2017
- August 2017
- July 2017
- June 2017
- May 2017
- April 2017
- March 2017
- February 2017
- January 2017
- December 2016
- November 2016
- October 2016
- September 2016
- August 2016
- July 2016
- June 2016
- May 2016
- April 2016
- March 2016
- February 2016
- January 2016
- December 2015
- November 2015
- October 2015
- September 2015
- August 2015
- July 2015
- June 2015
- February 2015
- January 2015
- December 2014
- November 2014
- October 2014
- September 2014
- August 2014
- July 2014
- June 2014
- May 2014
- April 2014
- March 2014
- February 2014
- January 2014
- December 2013
- November 2013
- October 2013